Disclaimer: This guide explains HPLC principles for educational purposes. Always work with accredited laboratories for official testing.
High Performance Liquid Chromatography (HPLC) is the most reliable method for determining peptide purity, yet many researchers use HPLC data without fully understanding what they're looking at. An HPLC chromatogram shows separated molecular species as peaks on a graph, but interpreting these peaks correctly requires understanding the underlying physics and chemistry. This guide explains HPLC from first principles, walks through real chromatogram interpretation, and shows you how to spot quality data versus questionable assay data.
What Is HPLC and Why Does It Matter for Peptides?
HPLC separates complex mixtures into individual molecular components based on their chemical properties. For peptides, this separation is critical because it distinguishes the desired active peptide from impurities, degradation products, and synthetic byproducts. A peptide that looks identical to the naked eye can contain vastly different purities depending on manufacturing quality. HPLC reveals what's actually in the sample.
Unlike less precise methods like simple liquid chromatography or basic spectroscopy, HPLC achieves resolution through high pressure (hence "high performance"), which forces the sample through a tightly packed column at controlled speed. This produces sharper separation and more accurate quantification. For research peptides, HPLC has become the industry standard precisely because assay data are reproducible and quantifiable.
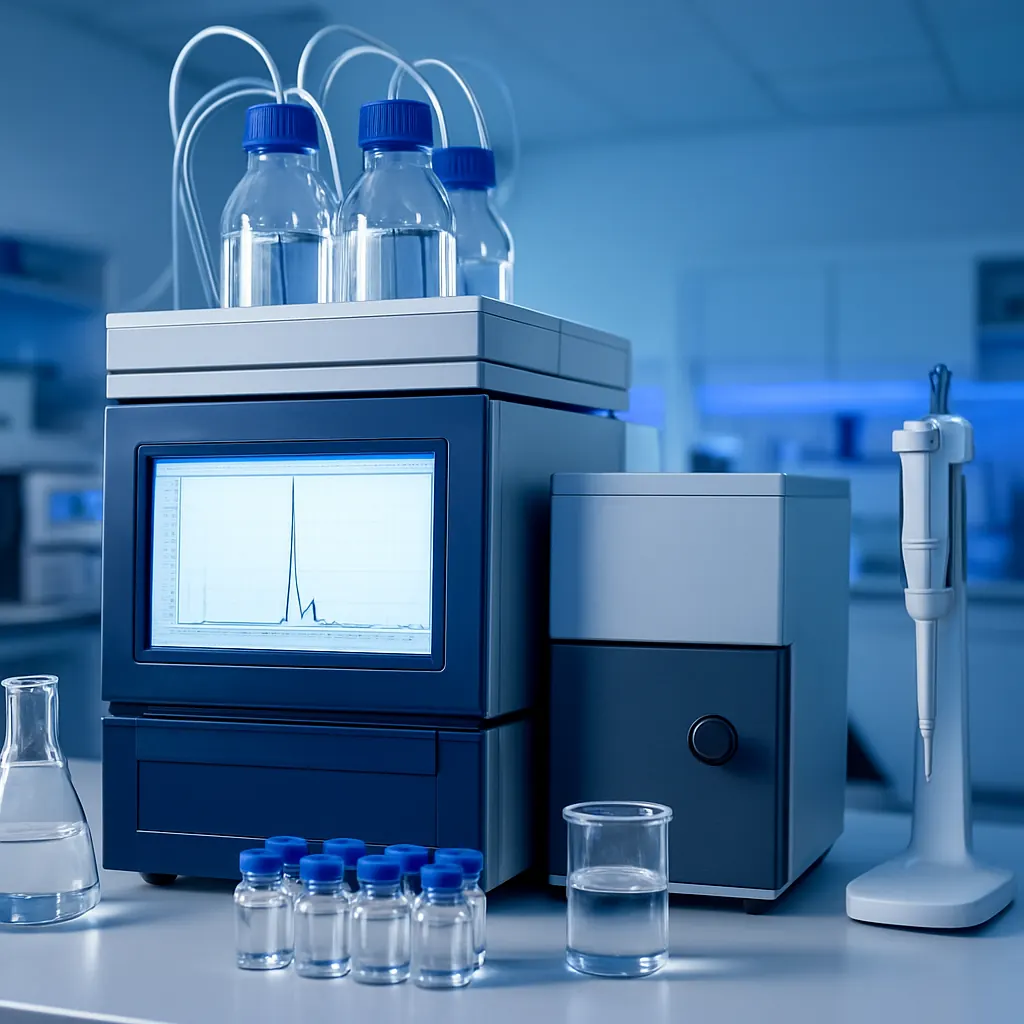
The HPLC System: Components Explained
The Pump
The pump is the system's heart, pushing mobile phase solvent through the column at precise, constant pressure (typically 200-350 bar for peptide analysis). HPLC pumps must deliver exactly consistent flow rates, otherwise peak shapes distort and quantification becomes unreliable. Modern quaternary pumps can mix multiple solvents at programmed ratios, enabling gradient methods that separate complex peptide mixtures.
Sample Introduction System
The sample introduction system introduces a precise volume of sample (typically 5-20 microliters for peptides) onto the column. Manual sample-introduction systems require careful technique; automated systems ensure reproducibility. The introduction volume is critical: too small and signal is weak; too large and peaks become distorted. Most peptide testing uses 10-20 microliter sample introductions.
The Column
The HPLC column is where separation actually occurs. A typical peptide column is 150-250mm long and 3-4.6mm internal diameter, packed with silica particles (typically 3-5 micrometers). The column's chemistry determines separation mode. For peptides, reversed-phase (RP-HPLC) is most common, where the stationary phase is hydrophobic and the mobile phase is polar. Peptides move through the column at different rates based on their hydrophobicity, achieving separation.
The Detector
The detector measures what exits the column. For peptide purity testing, UV-Vis detection at 214 nm is standard. This wavelength detects peptide bonds (carbonyl groups absorb strongly at 214 nm), making it ideal for detecting all peptides regardless of amino acid composition. The detector generates a signal proportional to peptide concentration, which appears as peaks on the chromatogram.
The Data System
Modern HPLC systems include computers that control all components, record detector output, and integrate peaks. Software calculates the area under each peak, which is proportional to analyte concentration. Peak integration is critical: software must correctly define peak boundaries to calculate accurate purity percentages.
The HPLC Method: Step-by-Step Process
1. Sample Preparation
The peptide sample is dissolved in mobile phase solvent, typically to a concentration of 1-10 mg/mL. The solvent choice matters: the sample must dissolve completely without degrading. For peptides, aqueous acetonitrile or aqueous methanol (50-70% organic) is typical. The sample is filtered through a 0.2-micron membrane to remove particles that could damage the column.
2. Method Development
Before analyzing samples, analysts develop a method. This involves:
- Selecting appropriate mobile phases (aqueous and organic solvents)
- Setting column temperature (typically 25-40°C for peptides)
- Establishing a gradient program (how solvent composition changes over time)
- Optimizing flow rate (typically 0.5-1.5 mL/min for 4.6mm columns)
- Setting UV wavelength for detection (214 nm for peptides)
The goal is achieving baseline resolution between the main peak and any impurities within reasonable analysis time (typically 20-40 minutes).
3. Calibration and Standards
HPLC requires calibration using reference standards. For purity testing, analysts typically run a pure peptide standard (if available) or a known mixture to verify the system responds correctly. This ensures that peak areas accurately reflect concentration. Without proper calibration, purity calculations are unreliable.
4. Sample introduction and Separation
Once the method is ready, the prepared sample is introduced. The HPLC pump forces the sample through the column at the programmed flow rate and gradient. As the sample travels through the column, different molecules separate based on their interactions with the stationary phase. Hydrophobic molecules (more like the column packing) move slowly; hydrophilic molecules move quickly. The result is temporal separation: molecules reach the detector at different times.
5. Detection and Peak Generation
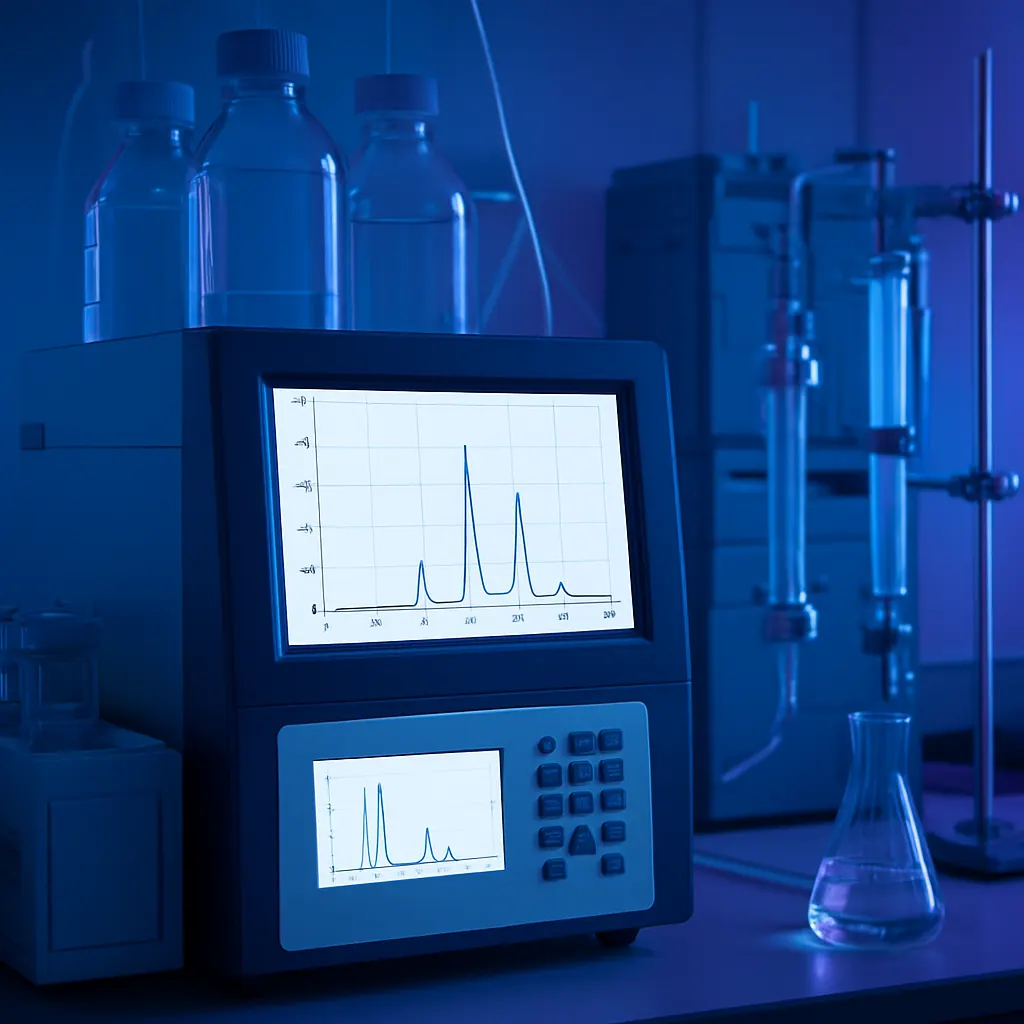
As each separated molecule exits the column and enters the UV detector, it absorbs light at 214 nm, generating a signal. This signal is recorded over time, producing the chromatogram: a graph showing detector response (y-axis) versus time (x-axis). Each peak represents a distinct molecular species.
Interpreting HPLC Chromatograms
Peak Identification
The main peak should represent your target peptide. For a 99% pure sample:
- Main peak: 99% of total peak area
- Minor peaks: <1% combined
In reality, a pure peptide typically shows a main peak representing 98-99% and small "tailing" peaks representing minor impurities.
Peak Shape Analysis
Good peaks are tall, sharp, and roughly symmetrical. A narrow peak indicates:
- Clean separation from impurities
- Good column performance
- Sample purity
Poor peaks are wide, asymmetrical, or double-peaked, indicating:
- Column degradation
- Method problems
- Sample aggregation or degradation
Fronting (peak asymmetry toward earlier elution) or tailing (asymmetry toward later elution) suggests interaction issues with the column. Moderate tailing is normal for some peptides, but severe tailing indicates problems.
Baseline and Noise
A clean HPLC run has a flat, stable baseline between peaks. High baseline noise indicates:
- Detector problems
- Contaminated mobile phase
- Air bubbles in the system
- Column degradation
Noise should be <1% of main peak height for reliable quantification.
Integration Quality
Software integration is where purity percentages are calculated. Peak integration requires:
- Correct peak boundaries (where each peak starts/ends)
- Appropriate baseline method
- Proper handling of overlapping peaks
Good laboratory practice requires manual review of integration—software isn't always correct, especially for closely-eluting peaks or peaks with tailing.
Mobile Phase Chemistry and Gradient Design
Reversed-Phase HPLC for Peptides
Reversed-phase (RP-HPLC) uses a hydrophobic stationary phase (typical column packing) and polar mobile phases. The aqueous component (typically 0.1% trifluoroacetic acid in water) and organic component (typically acetonitrile) are mixed in programmed proportions.
At the start of analysis, the mobile phase is mostly aqueous (e.g., 95% water, 5% acetonitrile). Peptides dissolve poorly in this composition and bind to the hydrophobic column. As the program progresses, organic solvent increases (gradient to 95% acetonitrile, 5% water), dissolving peptides and eluting them from the column.
Different peptides elute at different times based on hydrophobicity. A hydrophobic peptide requires high organic content to elute; a hydrophilic peptide elutes early.
Gradient Selection
Most peptide analyses use linear gradients: solvent composition increases steadily over 20-40 minutes. This provides reasonable separation in practical time. Alternative approaches include:
- Shallow gradients: Extend analysis time to maximum 90+ minutes for enhanced resolution
- Step gradients: Discrete solvent changes (less common for peptides)
- Isocratic methods: Constant solvent composition (only suitable for simple samples)
Gradient steepness directly affects resolution: slower gradients improve separation but increase analysis time.
Quantifying Purity from Peak Areas
Once peaks are integrated, purity is calculated as:
Purity (%) = (Area of main peak / Total area of all peaks) × 100
For example, if the main peptide peak has an area of 99,000 units and total peak area is 100,000:
Purity = (99,000 / 100,000) × 100 = 99%
This calculation assumes:
- All peaks are detected (nothing missed during analysis)
- Integration accurately captures peak boundaries
- The detector response is equal for all peptide-like compounds (approximately true for peptides at 214 nm)
Important Caveats
Some impurities don't absorb at 214 nm (heavy metals, salts, non-peptide residues), so HPLC purity represents peptide purity specifically, not total purity. Additional testing (ICP-MS for metals, Karl Fischer for water) measures other contaminants.
Common HPLC Issues and Troubleshooting
Peak Tailing
Excessive peak tailing typically indicates:
- pH-related interactions (adjust mobile phase pH)
- Residual free silanol (use buffered mobile phases, pH 3-7)
- Column aging (columns degrade after ~1000 sample introductions)
- Sample degradation during analysis
Split Peaks
Two peaks from what should be one peptide suggests:
- Different chemical forms (oxidised/reduced, ionisation states)
- Column overload (introduce less sample)
- Aggregation (prepare sample more carefully)
High Baseline Noise
Indicates contaminated mobile phase, air bubbles, or detector problems. Solutions include degassing mobile phase under vacuum and checking for leaks.
Misalignment Between Replicates
Run-to-run variation suggests introduction volume inconsistency, column degradation, or method parameters needing adjustment. Proper HPLC requires:
- Blank sample introductions between samples
- Regular system suitability tests
- Column maintenance every 500-1000 sample introductions
How Quality Testing Labs Validate Purity
Professional testing labs follow strict procedures:
- Pre-analysis verification: Check sample labeling, ensure proper documentation
- System suitability: Run reference standards to confirm HPLC system performs correctly
- Replicate analysis: Run each sample at least 2-3 times; if assay data vary >0.5%, investigate
- Peak identity confirmation: Mass spectrometry often confirms main peak is actually your peptide
- Documented reporting: Include chromatogram images, integration reports, and method parameters
A legitimate Certificate of Analysis includes the actual HPLC chromatogram as evidence. If a CoA claims 99% purity but shows no chromatogram, the testing is questionable.
Limitations of HPLC
While HPLC is excellent for purity determination, it has limitations:
- Doesn't confirm identity: A 99% pure peak might be the wrong compound. Mass spectrometry is needed for identity confirmation.
- Doesn't detect non-peptide contaminants: Heavy metals, salts, and non-chromophoric impurities won't show as HPLC peaks.
- Requires proper calibration: Without reference standards, purity calculations may be inaccurate.
- Operator-dependent: Method development and integration quality depend on analyst expertise.
Choosing Quality HPLC assay data
When evaluating peptide CoAs, look for:
- Actual chromatogram images: Not just numbers, but visual proof
- Method details: Column type, gradient program, flow rate, wavelength
- Integration report: Peak boundaries clearly marked
- Multiple sample introductions: Shows reproducibility (typically ±0.5% between replicates)
- Accredited lab: ISO 17025 or similar certification
- Reference standards: Confirms system suitability
Conclusion
HPLC is the gold standard for peptide purity because it provides objective, quantifiable separation and detection of molecular species. Understanding how HPLC works—from sample preparation through data interpretation—enables you to evaluate testing assay data critically and distinguish genuine quality from marketing claims. The next time you review a Certificate of Analysis, you'll understand what the chromatogram actually shows and whether the purity claim is legitimate.
Quality research demands quality purity data. HPLC provides exactly that when performed correctly by competent labs using proper methodology.
Frequently asked questions
Why is 214 nm the standard wavelength for peptide HPLC?
214 nm is where peptide bonds (carbonyl groups) absorb light most strongly. This wavelength detects essentially all peptides regardless of amino acid composition, making it ideal for universal peptide detection.
What does peak tailing mean and when should I worry?
Peak tailing is asymmetry toward later elution times. Minor tailing (symmetry factor 0.8-1.2) is normal, but severe tailing (>1.5) suggests column problems, pH issues, or sample degradation requiring investigation.
How do I know if an HPLC result is reliable?
Reliable assay data include: actual chromatogram images, documented method parameters, multiple sample introductions showing <0.5% variation, lab accreditation (ISO 17025), and mass spectrometry confirmation of peptide identity.
Can HPLC detect all impurities in a peptide sample?
HPLC detects molecules that absorb at 214 nm (peptides and related compounds). It doesn't detect non-chromophoric impurities like heavy metals or salts. Comprehensive testing requires HPLC plus additional methods (ICP-MS, Karl Fischer).
Why do HPLC assay data sometimes vary slightly between runs?
Minor variation (<0.5%) between replicate sample introductions is normal due to sampling variation and instrument precision. Larger variation suggests column degradation, method problems, or sample inconsistency.
Pros
- +Gold standard for peptide purity—objective, reproducible assay data
- +High resolution enables detection of closely-related impurities
- +Quantifiable purity percentages suitable for publication-quality research
- +Wide availability—most quality labs offer HPLC analysis
- +assay data can be combined with mass spectrometry for complete characterization
Cons
- -Doesn't confirm peptide identity—requires mass spectrometry for confirmation
- -Cannot detect non-chromophoric impurities (metals, salts)
- -Requires expertise for method development and proper interpretation
- -Expensive equipment and trained operators needed
- -Time-consuming (20-40 minutes per sample)
Frequently Asked Questions
Why is 214 nm the standard wavelength for peptide HPLC?
214 nm is where peptide bonds (carbonyl groups) absorb light most strongly. This wavelength detects essentially all peptides regardless of amino acid composition, making it ideal for universal peptide detection.
What does peak tailing mean and when should I worry?
Peak tailing is asymmetry toward later elution times. Minor tailing (symmetry factor 0.8-1.2) is normal, but severe tailing (>1.5) suggests column problems, pH issues, or sample degradation requiring investigation.
How do I know if an HPLC result is reliable?
Reliable assay data include: actual chromatogram images, documented method parameters, multiple sample introductions showing <0.5% variation, lab accreditation (ISO 17025), and mass spectrometry confirmation of peptide identity.
Can HPLC detect all impurities in a peptide sample?
HPLC detects molecules that absorb at 214 nm (peptides and related compounds). It doesn't detect non-chromophoric impurities like heavy metals or salts. Comprehensive testing requires HPLC plus additional methods (ICP-MS, Karl Fischer).
Why do HPLC assay data sometimes vary slightly between runs?
Minor variation (<0.5%) between replicate sample introductions is normal due to sampling variation and instrument precision. Larger variation suggests column degradation, method problems, or sample inconsistency.
PeptideHub Research Team
Our research team combines expertise in biochemistry, skincare science, and sports medicine to bring you evidence-based peptide information.
Ready to Explore Peptides?
Discover our selection of research-grade peptides and start your optimisation journey today.
Shop Peptides